Practical Malware Analysis - Lab 10 write-up

Kernel Debugging with WinDbg is the subject of Chapter 10. From this chapter I learned:
- How to set-up kernel debugging on a VM
- Useful commands for kernel debugging with WinDbg
- That the major function table tells us what is executed when a driver is called from user space
- That DeviceIoControl is a common request for a malicious kernel component
- That System Service Descriptor Table (SSDT) hooking is a technique used by rootkits to modify the kernel
This was my first experience with kernel debugging, so the labs took me quite some time to get through.
Lab 10-1
This lab includes both a driver and an executable. You can run the executable from anywhere, but in order for the program to work properly, the driver must be placed in the C:\Windows\System32 directory where it was originally found on the victim computer. The executable is Lab10-01.exe, and the driver is Lab10-01.sys.
1. Does this program make any direct changes to the registry? (Use procmon to check.)
Answer: Yes, but I could not find these changes in procmon. Regshot comparison results show that the following registry keys were added:
HKLM\SOFTWARE\Policies\Microsoft\WindowsFirewallHKLM\SOFTWARE\Policies\Microsoft\WindowsFirewall\DomainProfileHKLM\SOFTWARE\Policies\Microsoft\WindowsFirewall\StandardProfileHKLM\SYSTEM\ControlSet001\Enum\Root\LEGACY_LAB10-01HKLM\SYSTEM\ControlSet001\Enum\Root\LEGACY_LAB10-01\0000HKLM\SYSTEM\ControlSet001\Enum\Root\LEGACY_LAB10-01\0000\ControlHKLM\SYSTEM\ControlSet001\Services\Lab10-01HKLM\SYSTEM\ControlSet001\Services\Lab10-01\SecurityHKLM\SYSTEM\ControlSet001\Services\Lab10-01\EnumHKLM\SYSTEM\CurrentControlSet\Enum\Root\LEGACY_LAB10-01HKLM\SYSTEM\CurrentControlSet\Enum\Root\LEGACY_LAB10-01\0000HKLM\SYSTEM\CurrentControlSet\Enum\Root\LEGACY_LAB10-01\0000\ControlHKLM\SYSTEM\CurrentControlSet\Services\Lab10-01HKLM\SYSTEM\CurrentControlSet\Services\Lab10-01\SecurityHKLM\SYSTEM\CurrentControlSet\Services\Lab10-01\Enum
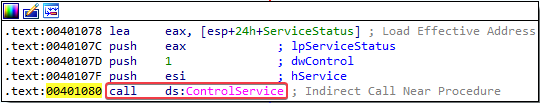
2. The user-space program calls the ControlService function. Can you set a breakpoint with WinDbg to see what is executed in the kernel as a result of the call to ControlService?
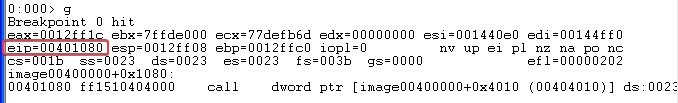
Answer: To see what is executed in the kernel as a result of the call to ControlService, I first used WinDbg inside the VM to set a breakpoint @ 00401080. This is where the call to ControlService is executed.
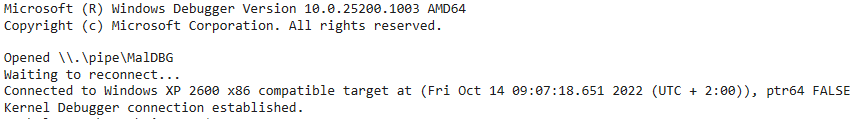
With the breakpoint hit, I switched over to the instance of WinDbg Preview on my host machine. This is attached to the kernel of the VM through a pipe set to \\.\pipe\MalDBG and a baud rate of 115200.
With the kernel debugger connection established, we can search for the driver object to the Lab10-01 service:
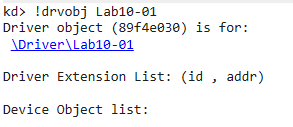
In this case, the address of the driver object is 89f4e030. We can now view its structure using the dt _DRIVER_OBJECT 89f4e030 command:
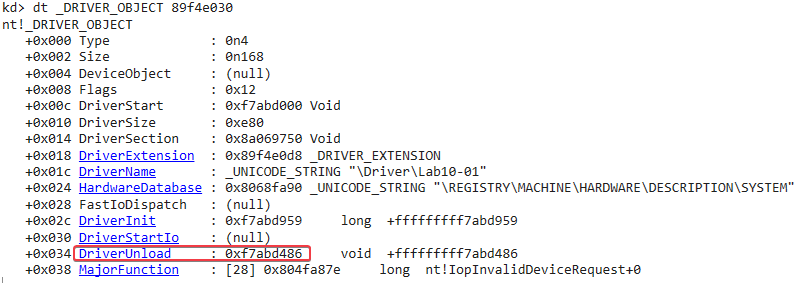
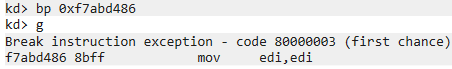
Since we want to find out what is executed in the kernel as a result of the call to ControlService, we can set a breakpoint in our kernel debugger at DriverUnload (located at 0xf7abd486). After resuming the kernel and continuing execution on the VM, we hit our breakpoint:
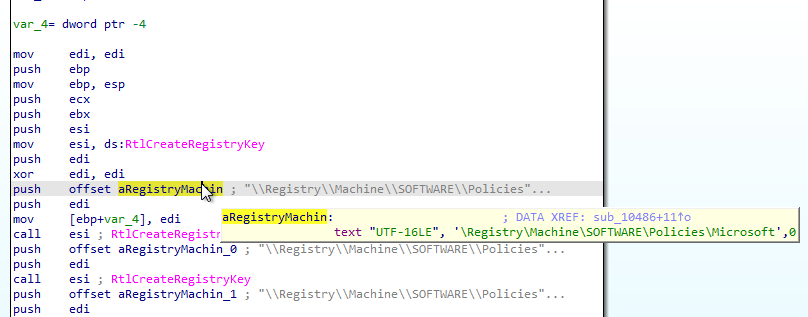
We can now step through the code and see that it is accessing registry keys:
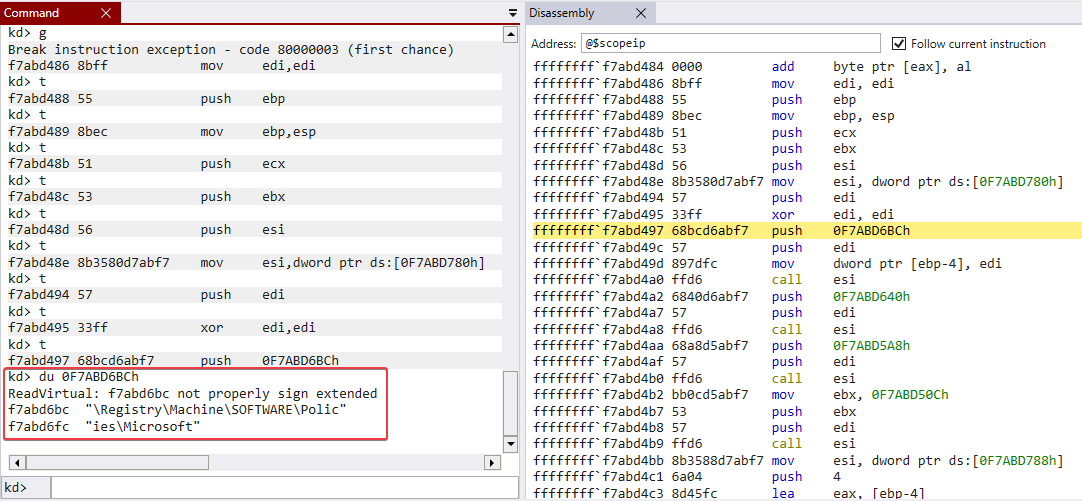
Stepping through the instructions above will reveal the same information as the things that we see when analysing the Lab10-01.sys driver in IDA.
3. What does this program do?
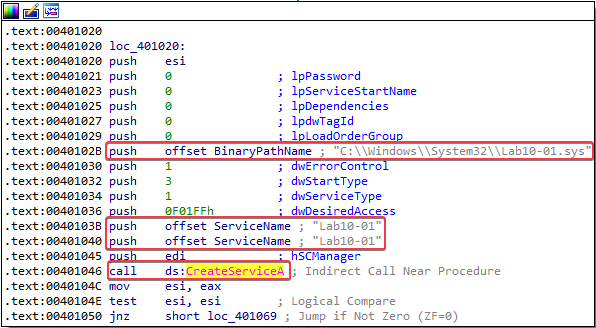
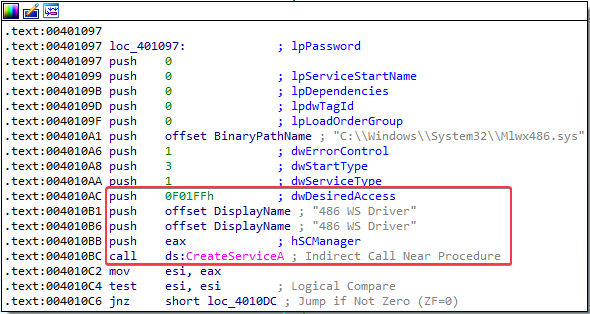
Answer: The program creates a service named “Lab10-01” with its path set to the Lab10-01.sys driver:
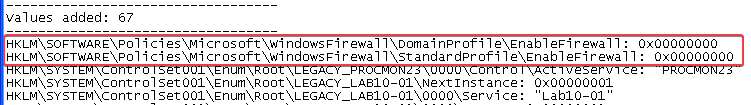
The driver disables the firewall on the target system by setting the following registry values to 0x00000000:
HKLM\SOFTWARE\Policies\Microsoft\WindowsFirewall\DomainProfile\EnableFirewallHKLM\SOFTWARE\Policies\Microsoft\WindowsFirewall\StandardProfile\EnableFirewall
Comparing my answers to the Lab 10-1 solutions
Conclusions after comparison:
- We could not find the changes in registry in procmon, because direct changes to the registry from the kernel go undetected by procmon.
Lab 10-2
The file for this lab is Lab10-02.exe.
1. Does this program create any files? If so, what are they?
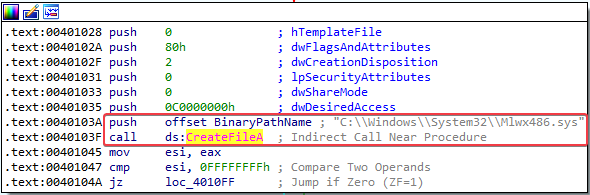
Answer: Yes, we can see that the program creates a driver file named Mlwx486.sys in C:\Windows\System32.
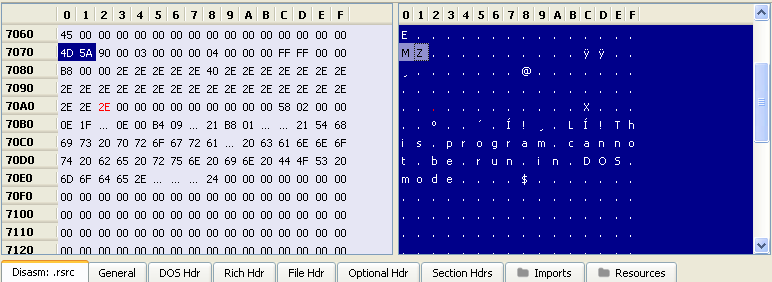
In the .rsrc section of the program we also see that the file contains another PE header:
The program uses the C:\Windows\System32\Mlwx486.sys file in a newly created service called 486 WS Driver:
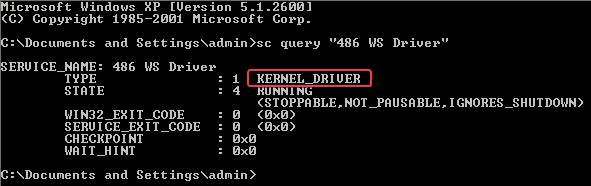
2. Does this program have a kernel component?
Answer: Yes, if we query the service that is created we see that it is a kernel driver:
3. What does this program do?
Answer: The program creates the C:\Windows\System32\Mlwx486.sys file and uses this path in a newly created service named “486 WS Driver”. This is a kernel driver. If we search for the C:\Windows\System32\Mlwx486.sys file, we cannot find it.
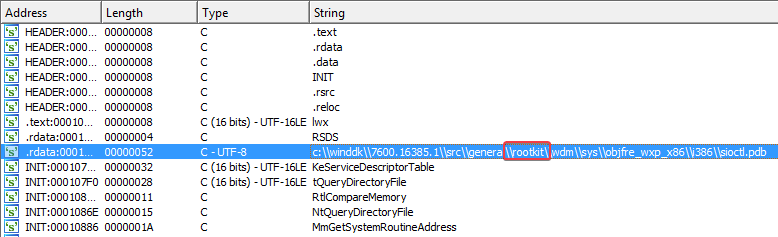
Exporting and analysing the executable within the .rsrc section of the program, we learn that this is actually the kernel driver. The driver has a very interesting string that contains the word “rootkit”:
Since the book mentioned that a technique called System Service Descriptor Table (SSDT) hooking is often used by rootkits, I checked the SSDT to see if any entries were overwritten. One of the memory locations immediately stands out:
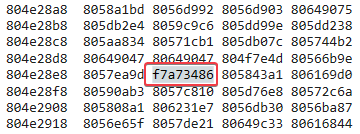
This entry is in a memory location that is outside the bounds of the ntoskrnl module. If we look at the loaded modules we see that the range should be between 804d7000 and 806ed680:

It is now clear that the program is hooking into a function in order to hide the Mlwx486.sys file that is located in C:\Windows\System32.
Comparing my answers to the Lab 10-2 solutions
Conclusions after comparison:
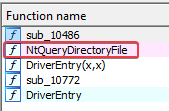
- We could have found the name of the function that the rootkit is hooking into by reverting our virtual machine to a state before the rootkit was installed. In this state, we could have looked at the offset into the SSDT that was overwritten. In this case, the function is
NtQueryDirectoryFile, which we could also see when analysing the malicious driver file in IDA:
Lab 10-3
This lab includes a driver and an executable. You can run the executable from anywhere, but in order for the program to work properly, the driver must be placed in the C:\Windows\System32 directory where it was originally found on the victim computer. The executable is Lab10-03.exe, and the driver is Lab10-03.sys.
1. What does this program do?
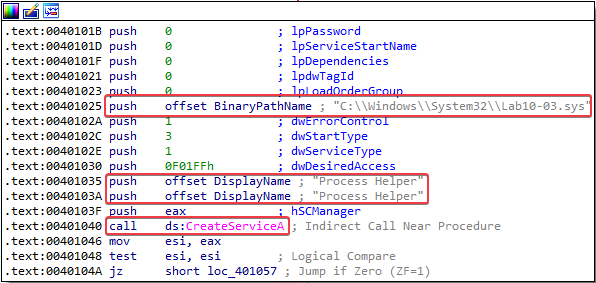
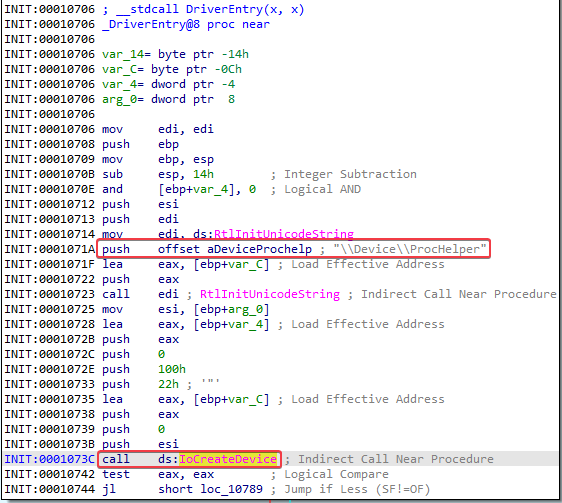
Answer: The program first creates a new service that uses the C:\Windows\System32\Lab10-03.sys driver path. The name of this service is Process Helper:
After this, a file named \\.\ProcHelper is created:
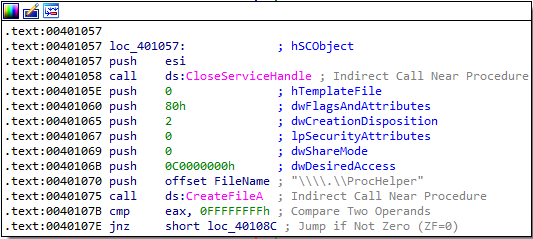
This \\.\ProcHelper file is a device object that the malware can use. Once the malware has a handle to the device object, it uses the DeviceIoControl function:
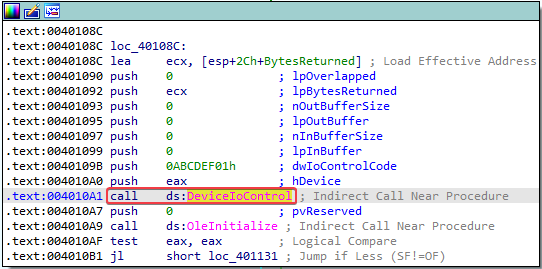
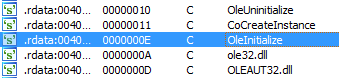
The program then uses the Component Object Model (COM). Each thread that uses COM must call the OleInitialize or ConInitializeEx function at least once prior to calling any other COM library functions. The imports table of this program shows OleInitialize:
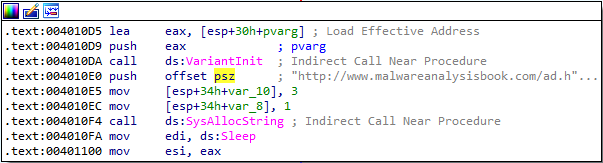
Further analysis shows that COM is used to open the http://www.malwareanalysisbook.com/ad.html page:

After opening this page, the program seems to be stuck in an infinite loop, sleeping for 30 seconds every time.
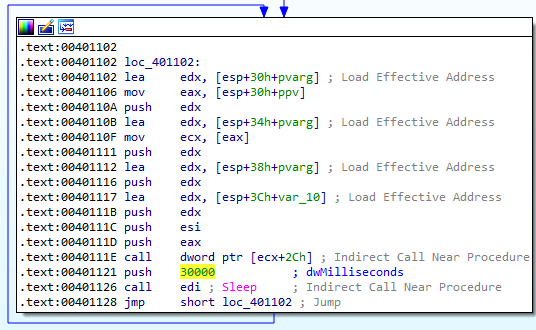
Dynamic analysis shows that the http://www.malwareanalysisbook.com/ad.html page pops up every 30 seconds.
2. Once this program is running, how do you stop it?
Answer: I could not find a way to stop the program. It cannot be found in the list of processes.
3. What does the kernel component do?
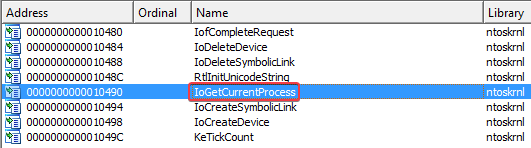
Answer: Examining the imports of the C:\Windows\System32\Lab10-03.sys file strongly hints that the kernel component hides the malicious process, as we also noticed in our answer to question 2. In the imports table we see that the program may use the IoGetCurrentProcess function of the ntoskrnl library.
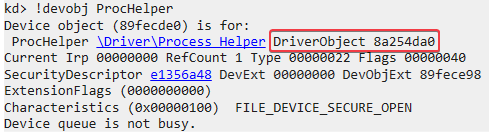
We can also see that the kernel file creates a device called ProcHelper:
I then looked for this device object in WinDbg. The information below shows us where the DriverObject is loaded in memory.
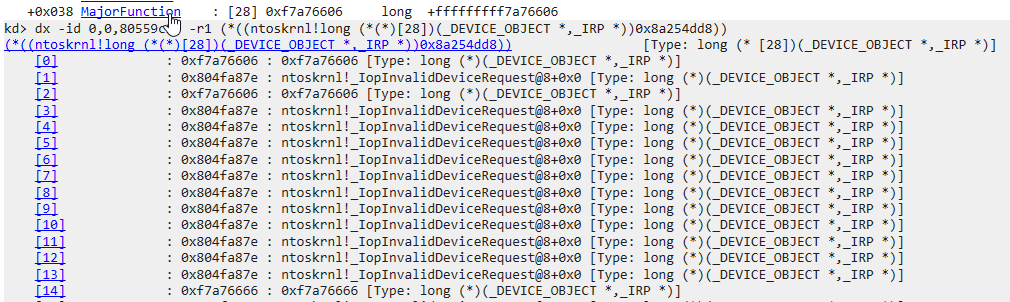
Now we can examine the function pointers of this driver object and get the offset to MajorFunction:
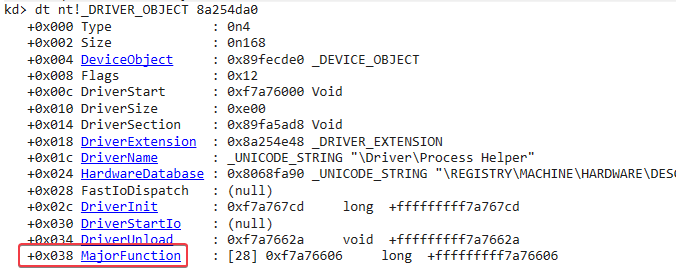
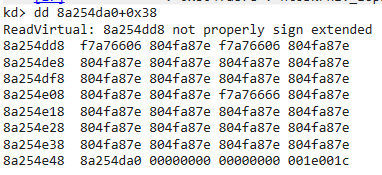
Since the offset is +0x38, we could use the dd 8a254da0+0x38 command to view the contents of the major function table:
But since I’m using WinDbg Preview, we can just click on MajorFunction and it will automatically run a command that also gets the function names:
We see a lot of 0x804fa87e entries, which point to the IopInvalidDeviceRequest function. This function does not seem that interesting. All it does it set the status to indicate that the operation requested is invalid for this device type.
This leaves 3 more interesting entries in the major function table:
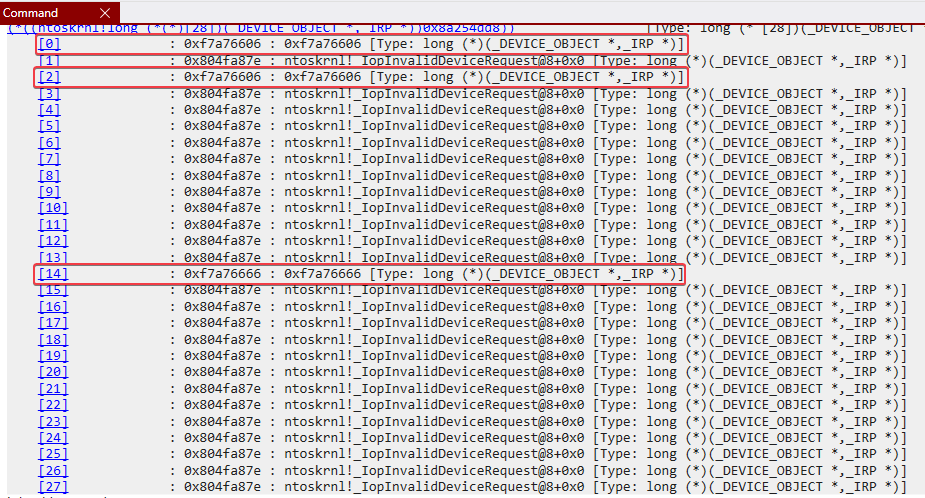
Note that 2 of these entries are pointing to the same address: 0xf7a76606. This means we have 2 possibly interesting functions that the driver object uses. Located at 0xf7a76606 and 0xf7a76666.
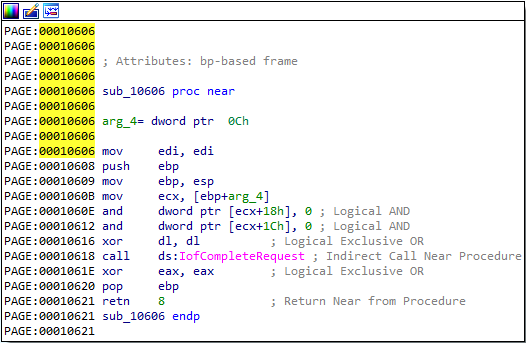
The function at offset 0x606 simply calls IofCompleteRequest and then returns:
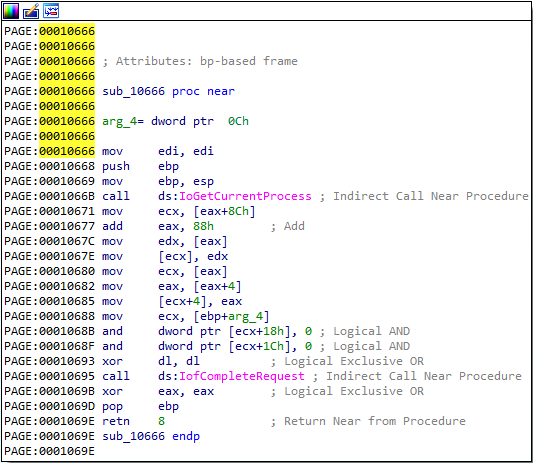
The function at offset 0x666 looks a lot more interesting. It calls the IoGetCurrentProcess function, which according to Microsoft documentation returns a pointer to the current process. It then performs some mov and add instructions before calling IofCompleteRequest and returning. I believe that this function is used to hide the malicious process from the process listing.
Comparing my answers to the Lab 10-3 solutions
Conclusions after comparison:
- We could’ve further examined the kernel component of this program to discover the following:
-
The call to
IoGetCurrentProcessin the function at offset 0x666 returns theEPROCESSstructure. It then accesses the data at an offset of 0x88 by performing theadd eax, 88hinstruction.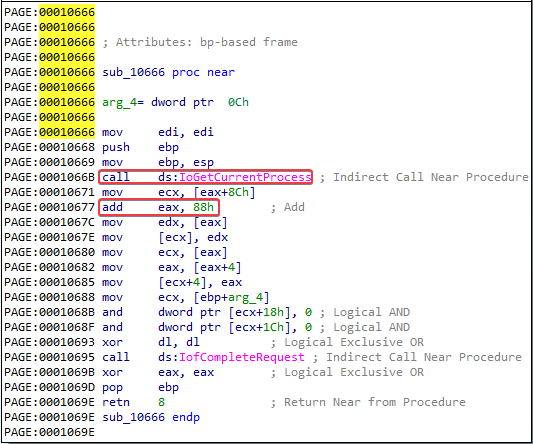
We can view the EPROCESS structure with thedt nt!_EPROCESScommand in WinDbg: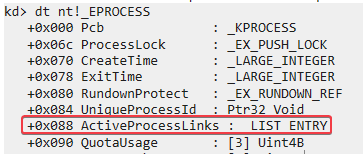
LIST_ENTRYis stored at offset 0x88. This structure is a double-linked list with two values:BLINK- which points to the previous entry in the list, andFLINK- which points to the next entry in the list. Let’s go back to the function at offset 0x666.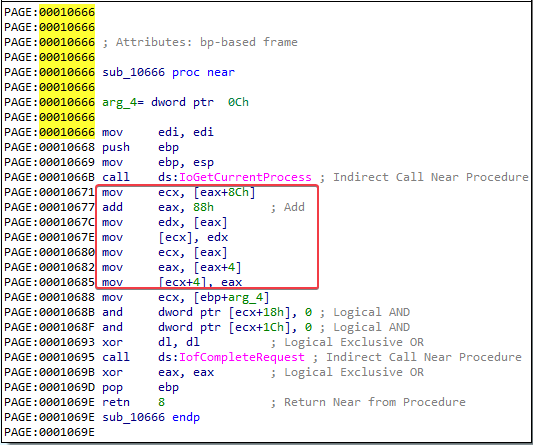
Themov ecx, [eax+8Ch]instruction obtains a pointer to the next entry in the list. Theadd eax, 88hinstruction accesses theLIST_ENTRYstructure. Themov edx, [eax]instruction obtains a pointer to the previous entry in the list. Themov [ecx], edxinstruction overwrites the BLINK pointer of the next entry pointed to the current entry. The next mov instructions perform the same steps, except to overwrite the FLINK pointer of the previous entry in the list to skip the current entry.These instructions hide the current process by unlinking it from the linked list of loaded process, as displayed in the figure below:
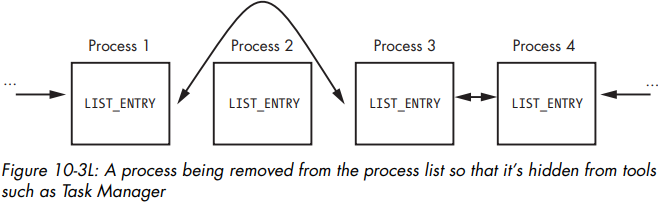
When the OS is running normally, each process has a pointer to the process before and after it. In the figure above, process number 2 has been hidden by the rootkit.
-